- What statistical metrics really affect the outcome of a football match
- Which xG metrics and shots on goal are important for predicting the match result
- What data on ball possession and passing accuracy should be considered when analyzing a football match
- What advanced metrics like pressing, PPDA, and xThreat are available through the football API
- How to use the football statistics API to get real-time match data
- How to use data from the football API to build a model for predicting match outcomes
What statistical metrics really affect the outcome of a football match
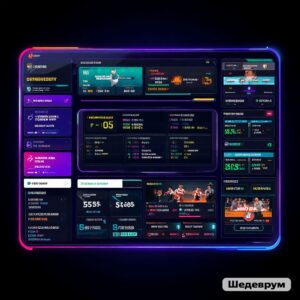
The result of a football match is influenced not only by the goals on the scoreboard but also by a whole range of quantitative indicators: the quantity and quality of shots, the structure of attacks, the balance of duels, discipline, and goalkeeper performance. It is this data that allows us to separate random results from systematic ones. Through the football API service api-sport.pro you can obtain detailed statistics for each match: from basic indicators (shots, fouls, offsides) to detailed groups like «Attack,» «Passes,» «Duels,» «Defending» with breakdowns by halves and totals for the game.
The structure of the endpoint /v2/football/matches is designed so that in one response you receive not only the score and status of the match but also an array matchStatistics. Inside it, metrics are organized by periods (ALL, 1ST, 2ND) and thematic groups. For example, you can immediately see the number of big goal-scoring chances (bigChanceCreated), the share of duels won (duelWonPercent), the number of touches in the penalty area (touchesInOppBox), successful tackles (wonTacklePercent) and goalkeeper saves (goalkeeperSaves). These parameters have a direct correlation with the probability of scoring or conceding and, consequently, with the final outcome of the match.
Using this data, analysts and developers build their own team strength models: assessing who created more danger, who controlled the pace, who used possession more effectively. Based on the sports events API, it is easy to implement dashboards for scouting and advanced statistics, recommendation systems for betting, and your own team rankings. Since api-sport.pro it supports multiple tournaments and countries, you can scale your algorithms from one championship to dozens of leagues without changing the logic of the code, simply by changing the filters of the API requests.
Example of a request for key match metrics via Football API
const API_KEY = 'YOUR_API_KEY';
async function getMatchWithStats(matchId) {
  const url = `https://api.api-sport.ru/v2/football/matches/${matchId}`;
  const res = await fetch(url, {
    headers: {
      'Authorization': API_KEY
    }
  });
  if (!res.ok) {
    throw new Error('Ошибка запроса к Sport Events API');
  }
  const match = await res.json();
  // Примеры метрик, влияющих на исход
  const statistics = match.matchStatistics;
  const odds = match.oddsBase; // базовые коэффициенты букмекеров
  console.log('Текущий счет:', match.homeScore.current, ':', match.awayScore.current);
  console.log('Минутa матча:', match.currentMatchMinute);
  console.log('Статистика матча:', statistics);
  console.log('Коэффициенты букмекеров:', odds);
}
getMatchWithStats(14570728).catch(console.error);
Which xG metrics and shots on goal are important for predicting the match result
The concept of expected goals (xG) has become a standard in modern football, but not every API returns a ready-made xG value. In the Sport Events API from api-sport.ru, the xG indicator is not yet provided as a separate field, but you receive all the raw data for calculation or approximate estimation: the total number of shots (totalShotsOnGoal), shots on target (shotsOnGoal), shots from the penalty area (totalShotsInsideBox) and beyond its limits (totalShotsOutsideBox), shots hitting the goal frame (hitWoodwork), as well as the number of big moments (bigChanceCreated, bigChanceScored, bigChanceMissed). In practice, it is this combination of metrics that provides the greatest predictive power.
If we simplify them into a basic model, then shots on target and shots from favorable positions will have a greater «weight» than long-range and blocked attempts. For example, each bigChanceCreated can be assessed as a high expected goal value, while a simple cross with a shot from outside the penalty area is assessed as low. Based on the API data, you can build your own xG model: set weights for types of shots, consider whether the shot was from inside the penalty area, whether the goalkeeper saved the ball or it went wide, and thus obtain an estimate of the «deserved» result of each match. This is especially useful in betting and long-term assessment of team strength when the current tournament result and actual score can be misleading.
For predicting future matches, dynamic indicators are also important: how often a team creates many shots but converts few chances, how consistently it allows shots on its goal. Shot and chance statistics, available through endpoints /v2/football/matches и /v2/football/matches/{matchId}, can be easily aggregated over a season or a series of rounds, allowing for the formation of complex features for machine learning models. By combining your own xG calculation with the frequency of hitting the woodwork, the share of shots from the penalty area, and the conversion of big moments, you build a much more accurate prediction than by using just the score and average number of shots.
An example of calculating a simplified «pseudo-xG» based on API data
function estimatePseudoXG(statsGroup) {
  // Простейшая линейная модель для иллюстрации подхода
  let totalShots = 0;
  let shotsOnTarget = 0;
  let shotsInsideBox = 0;
  let bigChances = 0;
  statsGroup.statisticsItems.forEach(item => {
    switch (item.key) {
      case 'totalShotsOnGoal':
        totalShots = item.homeValue; // или awayValue для гостевой команды
        break;
      case 'shotsOnGoal':
        shotsOnTarget = item.homeValue;
        break;
      case 'totalShotsInsideBox':
        shotsInsideBox = item.homeValue;
        break;
      case 'bigChanceCreated':
        bigChances = item.homeValue;
        break;
    }
  });
  // Весовые коэффициенты подобраны условно, в реальных моделях они обучаются на данных
  const xgEstimate =
    totalShots * 0.03 +
    shotsOnTarget * 0.08 +
    shotsInsideBox * 0.05 +
    bigChances * 0.35;
  return xgEstimate;
}
What data on ball possession and passing accuracy should be considered when analyzing a football match
Ball possession has long been a common metric in broadcasts, but in itself, it weakly correlates with the match outcome. Much more important is how the team uses possession in the final third, how quickly it advances the ball, and how accurate its passes are in dangerous areas. In the sports events API api-sport.pro you get not only the percentage of possession (ballPossession), but also a whole block of metrics on passes: total number of passes (passes), accurate passes (accuratePasses), entries into the final third (finalThirdEntries), effectiveness of play in the final third (finalThirdPhaseStatistic), accurate long passes (accurateLongBalls) and accurate crosses (accurateCross are available in the Sport Events API.).
By combining these indicators, teams can be divided into those that «hold the ball for possession» and those that truly dominate through positional play. For example, a high possession percentage with a low number of entries into the final third and a small number of touches in the penalty area (touchesInOppBox) indicates sterile control. In contrast, moderate possession with a large number of sharp passes and frequent entries into the final third often proves to be more effective. Models for assessing team strength based on Sport Events API data take into account not only possession share but also the structure of the passing network: how successfully the team advances the ball forward, whether it wins the battle for second balls, and how often it loses possession under pressure from the opponent.
An additional advantage of the API is that all these metrics are available by halves. This allows for analysis of how a team reacts to a conceded or scored goal, whether the ratio of possession and accuracy of passes changes after substitutions or adjustments by the coach. In practice, this is important for live analytics: if after the break there is a sharp increase in accurate passes and entries into the final third combined with an increase in the share of won duels, the team is likely to be increasing pressure and raising its chances of scoring. Such signals can be automated by regularly polling the endpoint. /v2/football/matches with status inprogress and reassessing the probabilities of match outcomes during the game.
Example of ball possession and passing statistics
async function getPossessionAndPasses(matchId) {
  const res = await fetch(`https://api.api-sport.ru/v2/football/matches/${matchId}`, {
    headers: { 'Authorization': 'YOUR_API_KEY' }
  });
  const match = await res.json();
  const allPeriod = match.matchStatistics.find(s => s.period === 'ALL');
  const overview = allPeriod.groups.find(g => g.groupName === 'Match overview');
  const passesGroup = allPeriod.groups.find(g => g.groupName === 'Passes');
  const possession = overview.statisticsItems.find(i => i.key === 'ballPossession');
  const accuratePasses = passesGroup.statisticsItems.find(i => i.key === 'accuratePasses');
  const finalThirdEntries = passesGroup.statisticsItems.find(i => i.key === 'finalThirdEntries');
  console.log('Владение (дом):', possession.homeValue, '%');
  console.log('Владение (гости):', possession.awayValue, '%');
  console.log('Точные пасы (дом):', accuratePasses.homeValue);
  console.log('Входы в финальную треть (дом):', finalThirdEntries.homeValue);
}
What advanced metrics like pressing, PPDA, and xThreat are available through the football API
High-level metrics such as pressing intensity, PPDA (passes allowed per defensive action), and xThreat are not returned as ready-made fields in the Sport Events API. However, the API provides a rich set of basic statistics to build advanced analytical models based on it. In particular, data on tackles (totalTackle, wonTacklePercent), interceptions (interceptionWon), interceptions and ball recoveries (ballRecovery), won duels (duelWonPercent), entries into the final third (finalThirdEntries) and touches in the opponent’s penalty area (touchesInOppBox) are available. These indicators form the basis for calculating pressing intensity and territorial advantage.
Classic PPDA requires knowledge of the number of opponent’s passes in the attacking zone and the number of defensive actions by the team in that area. Within the api-sport.ru API, approximate metrics can be constructed using total interceptions, tackles, and the total number of opponent passes. The higher the share of the opponent’s defensive actions against their own passing activity, the more aggressive the pressing appears. Similarly for xThreat: although there is no explicit field map or expected threat by zones, the combination of metrics on entries into the final third, touches in the penalty area, number of shots from dangerous positions, and quality of passes in the finishing stage allows for building one’s own threat models, training them on historical data obtained through the football API.
The approach of most professional analytical teams is to regularly export match statistics for tournaments through /v2/football/matches with filtering by season and tournament, normalize metrics per minute of play or per possession, and then build calculated indices for pressing, PPDA, and xThreat for each team and match. Since the API response structure is stable and detailed by halves, such metrics can be calculated both for the match as a whole and separately for the first and second halves, which is especially important for assessing team adaptation and the effectiveness of tactical changes.
Example of extracting basic data for calculating pressing and PPDA
async function getDefensiveBaseStats(matchId) {
  const res = await fetch(`https://api.api-sport.ru/v2/football/matches/${matchId}`, {
    headers: { 'Authorization': 'YOUR_API_KEY' }
  });
  const match = await res.json();
  const all = match.matchStatistics.find(s => s.period === 'ALL');
  const defending = all.groups.find(g => g.groupName === 'Defending');
  const passesOverview = all.groups.find(g => g.groupName === 'Match overview');
  const interceptions = defending.statisticsItems.find(i => i.key === 'interceptionWon');
  const tackles = defending.statisticsItems.find(i => i.key === 'totalTackle');
  const recoveries = defending.statisticsItems.find(i => i.key === 'ballRecovery');
  const totalPasses = passesOverview.statisticsItems.find(i => i.key === 'passes');
  const defensiveActionsHome = interceptions.homeValue + tackles.homeValue + recoveries.homeValue;
  const defensiveActionsAway = interceptions.awayValue + tackles.awayValue + recoveries.awayValue;
  console.log('Базовые оборонительные действия (дом):', defensiveActionsHome);
  console.log('Базовые оборонительные действия (гости):', defensiveActionsAway);
  console.log('Общее число пасов (дом):', totalPasses.homeValue);
  console.log('Общее число пасов (гости):', totalPasses.awayValue);
}
How to use the football statistics API to get real-time match data
For live analytics, it is critical to receive not only the final match statistics but also operational data during the game. The endpoint /v2/football/matches in the Sport Events API supports filtering by status, so you can request only the ongoing matches by specifying status=inprogress. In the response for each match, the current minute will be available (currentMatchMinute), the updated score, detailed statistics on shots, possession, and duels, as well as an array liveEvents with the chronology of events: goals, cards, substitutions, penalties, VAR decisions. This allows you to build your own match trackers, push notifications, and live betting algorithms.
The current version of the API implements a polling model: you determine the frequency of requests and balance between timeliness and system load. In upcoming releases, your personal account at api-sport.ru support for WebSocket connections will be added, allowing real-time updates without constant HTTP requests. For most analytics tasks, polling the endpoint every 10-20 seconds is sufficient, reassessing outcome probabilities considering new events and changes in statistics (for example, an increase in pressure from one team after conceding a goal) and comparing this with the movement of bookmaker odds, which are also available in the field oddsBase.
The integration of live data is especially valuable for automated strategies: you can track threshold values (for example, a sharp increase in the share of shots from one team or an increase in the number of touches in the penalty area), and as soon as the metrics cross a predefined level, trigger actions in your application—from highlighting the match in the interface to automatically generating betting tips. Since the API supports several sports (football, hockey, basketball, tennis, esports, and others), a unified approach to working with live events can be scaled across the entire product without changing the architecture.
Example of a periodic request for live data on matches
const API_KEY = 'YOUR_API_KEY';
async function pollLiveMatches() {
  const url = 'https://api.api-sport.ru/v2/football/matches?status=inprogress';
  const res = await fetch(url, {
    headers: { 'Authorization': API_KEY }
  });
  if (!res.ok) {
    console.error('Ошибка получения live-матчей');
    return;
  }
  const data = await res.json();
  data.matches.forEach(match => {
    console.log(`Матч ${match.homeTeam.name} - ${match.awayTeam.name}`);
    console.log('Минута:', match.currentMatchMinute);
    console.log('Счет:', match.homeScore.current, ':', match.awayScore.current);
    console.log('Последние события:', match.liveEvents.slice(-3));
  });
}
// Опрос каждые 15 секунд (до появления WebSocket)
setInterval(pollLiveMatches, 15000);
How to use data from the football API to build a model for predicting match outcomes
Building a quality model for predicting match outcomes starts with a reliable data source. The Football API service api-sport.ru provides all the necessary components: match results with detailed statistics, data on tournaments, teams, and players, as well as bookmaker odds in the field oddsBase. The basic workflow includes several steps: bulk downloading historical matches for the tournaments of interest, generating features from statistics, adding information about the strength of opponents and context (home/away, schedule density, tournament stage), and then training and validating the model (from simple logistic regression to gradient boosting or neural networks).
To obtain a data corpus, you can use the endpoint /v2/football/matches with filtering by season and tournament, going through dates or pages of the calendar and saving the results to your database. From the field matchStatistics quantitative features are formed: shots on target, share of shots from the penalty area, number of big chances, percentage of duels won, efficiency in the final third, share of long passes, and so on. From oddsBase the initial and current odds are taken as market estimates of probabilities. The combination of «raw» statistical metrics and market quotes usually provides significantly better predictive power than each source individually.
After training the model, it is important to organize its operation in production. Here again, the sports events API helps: for each upcoming match, you can get the latest available data on teams, their results in the current season, live statistics during the game, and updated bookmaker odds. This allows for assessing pre-match probabilities as well as adapting predictions after the starting whistle. In the future, based on the same data, it is possible to build higher-level AI services — for example, betting recommendations or tips for the coaching staff that combine historical and live analytics.
Example of preparing a dataset for the prediction model
import requests
API_KEY = 'YOUR_API_KEY'
BASE_URL = 'https://api.api-sport.ru/v2/football/matches'
headers = {
    'Authorization': API_KEY
}

def fetch_matches_by_date(date: str):
    params = {
        'date': date,
        'status': 'finished'
    }
    r = requests.get(BASE_URL, headers=headers, params=params, timeout=10)
    r.raise_for_status()
    return r.json()['matches']

def build_features(match):
    stats_all = next(s for s in match['matchStatistics'] if s['period'] == 'ALL')
    overview = next(g for g in stats_all['groups'] if g['groupName'] == 'Match overview')
    shots = next(g for g in stats_all['groups'] if g['groupName'] == 'Shots')
    def get_item(group, key):
        return next(i for i in group['statisticsItems'] if i['key'] == key)
    ball_possession = get_item(overview, 'ballPossession')
    total_shots = get_item(shots, 'totalShotsOnGoal')
    shots_on_target = get_item(shots, 'shotsOnGoal')
    # Пример фичей для домашней команды
    features_home = {
        'ball_possession_home': ball_possession['homeValue'],
        'total_shots_home': total_shots['homeValue'],
        'shots_on_target_home': shots_on_target['homeValue'],
        'goals_home': match['homeScore']['current'],
        'goals_away': match['awayScore']['current'],
    }
    return features_home

if __name__ == '__main__':
    matches = fetch_matches_by_date('2025-09-03')
    dataset = [build_features(m) for m in matches]
    print('Количество записей в датасете:', len(dataset))