- What is a live timeline of a football match and why is it needed
- How to choose a sports events API for a live timeline: criteria and prices
- What data on goals, shots, and cards can be obtained through a football API
- Step-by-step guide: how to create an interactive live timeline on a website using an API
- How to set up real-time updates for a live timeline: webhooks, WebSocket, and polling
- How to visualize goals, shots, and cards in a live timeline: UX tips and implementation examples
What is a live timeline of a football match and why is it needed
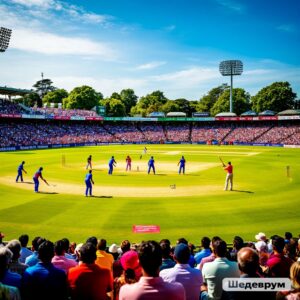
A match live timeline is an interactive event feed that shows in real time what is happening on the field: goals, dangerous shots, yellow and red cards, substitutions, added time. Unlike a simple goal counter or text commentary, the timeline provides a visual timeline of the match, where each event is tied to a minute and context. The user can understand the dynamics of the match at a glance: when the pressure started, during which segment cards were issued, how quickly the team equalized after conceding a goal.
For media sites, betting services, analytical platforms, and fan applications, such a live timeline becomes a key element in retaining the audience. The user sees not just a score of 2:1, but a living story of the game: who scored, from a penalty or from open play, which team dominated in shots, after which moment the course of the match changed. By using data from por el API de eventos deportivos api-sport.ru, such a timeline can be built automatically, without manual input, with updates every minute or even more frequently.
A modern live timeline can easily be expanded with additional layers of information: pop-up hints with episode details, player previews, links to video highlights, static and live betting odds. With proper integration through a sports API, the timeline turns into a full-fledged match center, around which sections for statistics, betting, fan chat, and personalized recommendations are built. That is why advanced work with match events through an API becomes a competitive advantage for any sports project.
How to choose a sports events API for a live timeline: criteria and prices
For the interactive live timeline to work stably and accurately reflect the course of the match, the correct choice of data provider is critical. First of all, the depth and structure of events are considered: the API must return not only goals and the final score but also detailed live events with the minute, type (goal, card, substitution, etc.), team, player, and current result. The presence of the current minute of the match parameter (for example, minutoDelPartidoActual) and the status of the meeting (no comenzado, en progreso, completado) is important to correctly maintain the timeline and stop updates at the end of the game.
The second block of criteria is reliability and economy. For live projects, minimal update latency, high API availability, and a clear limit policy are important: how many requests per minute/day you can make without the risk of blocking, how tariffs are structured, whether there are special plans for live betting and media. The service api-sport.pro has a pricing grid designed for both startups and large platforms, and the cost is predictable: you pay for access to sports and the volume of requests, without hidden surcharges for live mode.
The third aspect is the technology stack: the presence of well-documented OpenAPI documentation, uniform endpoints for different sports, fields for bookmaker odds (oddsBase), support for advanced match statistics (estadísticasDelPartido) and planned real-time channels (WebSocket, AI hints). Below is an example of a simple request to get all current live football matches using the Sport Events API:
fetch("https://api.api-sport.ru/v2/football/matches?status=inprogress", {
  headers: {
    Authorization: "YOUR_API_KEY" // ключ из личного кабинета api-sport.ru
  }
})
  .then(response => response.json())
  .then(data => {
    console.log("Всего матчей в лайве:", data.totalMatches);
    // Далее можно построить список матчей для выбора таймлайна
  })
  .catch(console.error);
This basic endpoint becomes the starting point: you show a list of live games, the user selects the desired match, and then your frontend starts working with the detailed events of that specific meeting.
What data on goals, shots, and cards can be obtained through a football API
The Sport Events API based on the football endpoint provides a detailed dataset necessary for building a rich live timeline. For a specific match, you receive an object. partido, which has status parameters, current minute (minutoDelPartidoActual), score by time and total time (puntajeLocal, puntajeVisitante), as well as an array eventosEnVivo. In each element LiveEvent the minute of the event is specified (tiempo), type (type: goal, tarjeta, substitution, varDecision, período and others), team (equipo: home or away), player, reason (reason) and score after the event (puntajeLocal, puntajeVisitante).
Thanks to this, you can distinguish between a penalty goal and a goal from play (field de), build separate markers for yellow and red cards, display labels with the names of the scorers and offenders, highlight VAR episodes and periods (start/end of halves, added time). At the same time, the array estadísticasDelPartido provides aggregated statistics on shots (totalDisparosALaPortería, disparosALaPortería, shotsOffGoal, totalDisparosDentroDelÁrea, totalShotsOutsideBox), ball possession (ballPossession), cards (tarjetas amarillas), fouls, corners, and a multitude of other metrics, grouped by match period.
To obtain all match events sorted by time, it is convenient to use a specialized endpoint /matches/{matchId}/events. Below is an example request and a fragment of the response, which can then be directly converted into points on the timeline:
fetch("https://api.api-sport.ru/v2/football/matches/14570728/events", {
  headers: {
    Authorization: "YOUR_API_KEY"
  }
})
  .then(r => r.json())
  .then(data => {
    data.events.forEach(event => {
      console.log(event.time, event.type, event.reason, event.homeScore + ":" + event.awayScore);
    });
  });
{
  "matchId": 14570728,
  "totalEvents": 23,
  "events": [
    { "time": 12, "type": "goal", "team": "home", "player": {"name": "Player A"}, "homeScore": 1, "awayScore": 0 },
    { "time": 35, "type": "card", "class": "yellow", "team": "away", "player": {"name": "Player B"}, "reason": "Foul" }
    // ... другие события
  ]
}
With such a structure, you can group events by types, count the intensity of shots in specific time segments, and also build additional graphs and widgets over the timeline for advanced analytics.
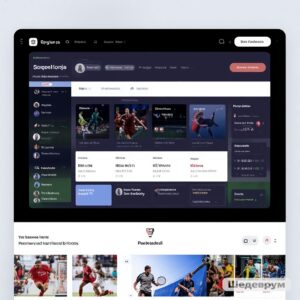
Step-by-step guide: how to create an interactive live timeline on a website using an API
Creating a full-fledged live timeline starts with connecting to a reliable sports events API. First, you register and obtain an access key at la cuenta personal.. Then you select the sport (for example, football) and find the desired match through the endpoint /v2/fútbol/partidos with filters by status, date, tournament, or team. After selecting the match by its matchId you request detailed events through /v2/football/matches/{matchId}/events or use an array eventosEnVivo de /matches/{matchId}, to initialize the initial state of the timeline.
The next step is preparing data for the frontend. Events are sorted by the field tiempo (if the server hasn’t done this), standardized to a common format, and enriched with additional information: team name, color for cards, type of icon for goals, penalties, or own goals. At the same time, you calculate the maximum duration of the match (90 minutes plus possible stoppage time and extra time in cup matches) to set the scale of the timeline. At this stage, it is convenient to store events in an array where each element contains the minute, type, label, and metadata fields for rendering.
The final step is rendering the interactive component. On the frontend, you create a horizontal line (for example, in HTML/CSS or using SVG/Canvas), where the X-axis represents the minutes of the match, and event markers are calculated as a percentage of the total length of the scale. When clicking on a marker, a card with detailed information is displayed: goal scorer, assistant, card type, current score, link to the highlight from the field. momentosDestacados. Below is an example of minimal logic in JavaScript that transforms the API response into convenient points for visualization:
async function buildTimeline(matchId) {
  const res = await fetch(`https://api.api-sport.ru/v2/football/matches/${matchId}/events`, {
    headers: { Authorization: "YOUR_API_KEY" }
  });
  const data = await res.json();
  const duration = 95; // базовая продолжительность, можно уточнять по событиям типа injuryTime
  const points = data.events.map(event => ({
    minute: event.time,
    position: (event.time / duration) * 100,
    type: event.type,
    team: event.team,
    label: event.reason || event.type,
    score: `${event.homeScore}:${event.awayScore}`
  }));
  // Далее points используется для генерации DOM-элементов на шкале времени
  return points;
}
After the initial setup, you add an update mechanism (polling or WebSocket) and gradually enrich the component: highlighting the active phase of the match, filters by event types, and adaptive layout for mobile devices. api-sport.pro The data structure is unified for different sports, so you can easily replicate this scenario for basketball, hockey, or esports.
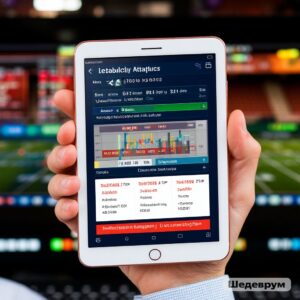
How to set up real-time updates for a live timeline: webhooks, WebSocket, and polling
An interactive live timeline reveals its potential only with timely data updates. The basic and most universal approach is periodic polling of the API. Your server or frontend makes a request to the endpoint at a certain interval (for example, every 15–30 seconds), /v2/fútbol/partidos/{matchId} or /matches/{matchId}/events, compares new events with those already saved, and adds to the timeline only what has appeared since the last update. This method is fully controlled by you and does not require separate infrastructure.
The second popular option is using webhooks, where your backend receives HTTP notifications from an intermediary service for each new match event. The Sport Events API operates on a request-response model, but you can build your own layer on top of it: a small service regularly polls, 2. api.api-sport.ru, and when new events appear, sends webhooks to your applications. This reduces the load on the frontend and allows for centralized processing of updates, caching responses, and synchronizing multiple data consumers.
The third, most operational method is a WebSocket connection. In upcoming updates, api-sport.ru plans to add a native WebSocket channel, where match events will stream in without constant HTTP requests. While this functionality is in development, it makes sense to combine polling with smart degradation: increasing the polling interval during pauses and decreasing it during key phases (start of the match, last minutes, penalties). An example of the simplest polling implementation in JavaScript:
function startLiveUpdates(matchId) {
  let lastTotalEvents = 0;
  async function tick() {
    const res = await fetch(`https://api.api-sport.ru/v2/football/matches/${matchId}/events`, {
      headers: { Authorization: "YOUR_API_KEY" }
    });
    const data = await res.json();
    if (data.totalEvents > lastTotalEvents) {
      const newEvents = data.events.slice(lastTotalEvents);
      renderNewEventsOnTimeline(newEvents); // ваша функция отрисовки
      lastTotalEvents = data.totalEvents;
    }
    // при окончании матча можно остановить опрос по статусу матча
    setTimeout(tick, 20000); // опрос каждые 20 секунд
  }
  tick();
}
This structure is easily extensible: you can add match status control, dynamically change request frequency, log delays, and build your own analytics on update speed. When switching to a WebSocket channel, the timeline logic will remain the same; only the method of delivering events will change.
How to visualize goals, shots, and cards in a live timeline: UX tips and implementation examples
A successful live timeline is not only about accurate data but also thoughtful visualization. The user should be able to distinguish goals, dangerous shots, and cards at a glance, understand which team attacked, and when the game turned. For this, a clear color coding is used (green – goal, yellow – yellow card, red – red card, blue – shot), different marker shapes, and symmetrical placement of events vertically relative to the center line for home and away teams. Tooltips on hover or click reveal details: author, assistant, type of violation, current score.
1. Adaptation for different devices is important. On desktop, it is convenient to show the full match timeline with markings by minutes, halves, and extra time, while on mobile devices – to make a horizontal scroll with enlarged markers and brief captions. With a large number of events (for example, in a match with an abundance of shots), it is useful to add filters: the user can leave only goals and cards or only moments of their team on the timeline. A good practice is to link the timeline with a general statistics block and video highlights: clicking on a marker immediately opens the highlight available through the API response. momentosDestacados 2. Below is a simplified example of the HTML structure and CSS classes for the timeline, which can then be dynamically filled with data from the Sport Events API:.
3. Next, your JavaScript logic substitutes the position
<div class="match-timeline">
  <div class="timeline-line"></div>
  <!-- Маркеры генерируются на основе массива событий -->
  <div class="timeline-event goal home" style="left: 23%" data-minute="23">
    <span class="icon">⚽</span>
  </div>
  <div class="timeline-event yellow-card away" style="left: 57%" data-minute="57">
    <span class="icon">🟨</span>
  </div>
</div>
4. left 5. in percentages depending on the minute of the event, attaches click handlers, and links each marker with the event object from the API. This approach easily scales to other sports supported by api-sport.ru: hockey, basketball, tennis, table tennis, and esports, just by changing the set of icons and the timeline (periods, quarters, sets). As a result, the live timeline turns into a universal, recognizable component for the user that provides a complete picture of the match in just a few seconds. 6. Quote provider parser: how to get data from bookmakers.